
Each candle summarises price movements over an interval. On a one-minute candlestick chart, each candle represents one minute. It does not represent one of your trades: candles form even when you are not trading.
Recognise the four values
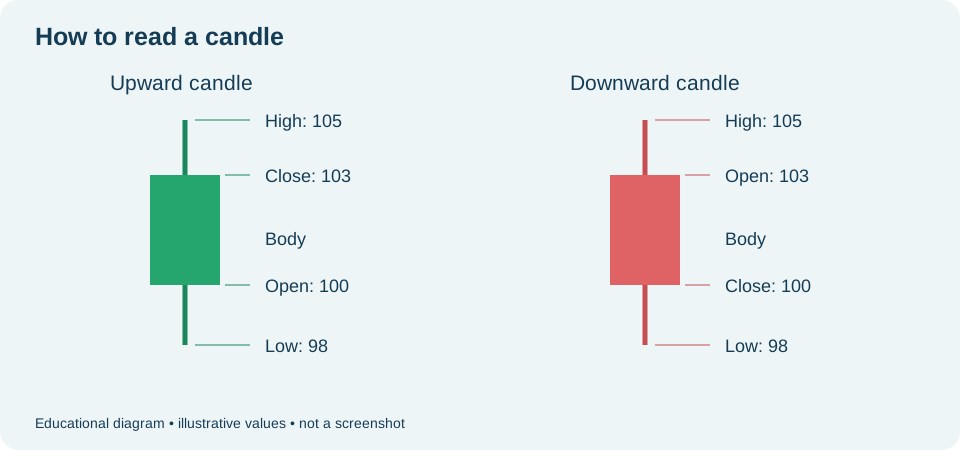
- Open: price at the candle's start.
- Close: price at the interval's end. It still changes while the candle is open.
- High: highest price recorded within the candle.
- Low: lowest price recorded within the candle.
The rectangle is the body, connecting open and close. The thin lines above and below are wicks, showing how far price moved beyond the body. If open and close are close together, the body may be small. If an extreme matches the body's edge, that side may have no visible wick.
Understand colour
In the conventional view, the rising colour means close above open; the falling colour means close below open. In the captured session, rising candles are green and falling candles reddish. Colour is a visual aid: compare prices if unsure.
A candle opening at 100, with a high of 105, low of 98 and close of 103 is rising. It reached prices above and below its body but finished above its open. This alone does not reveal the exact order of all those prices.
Check the period before comparing
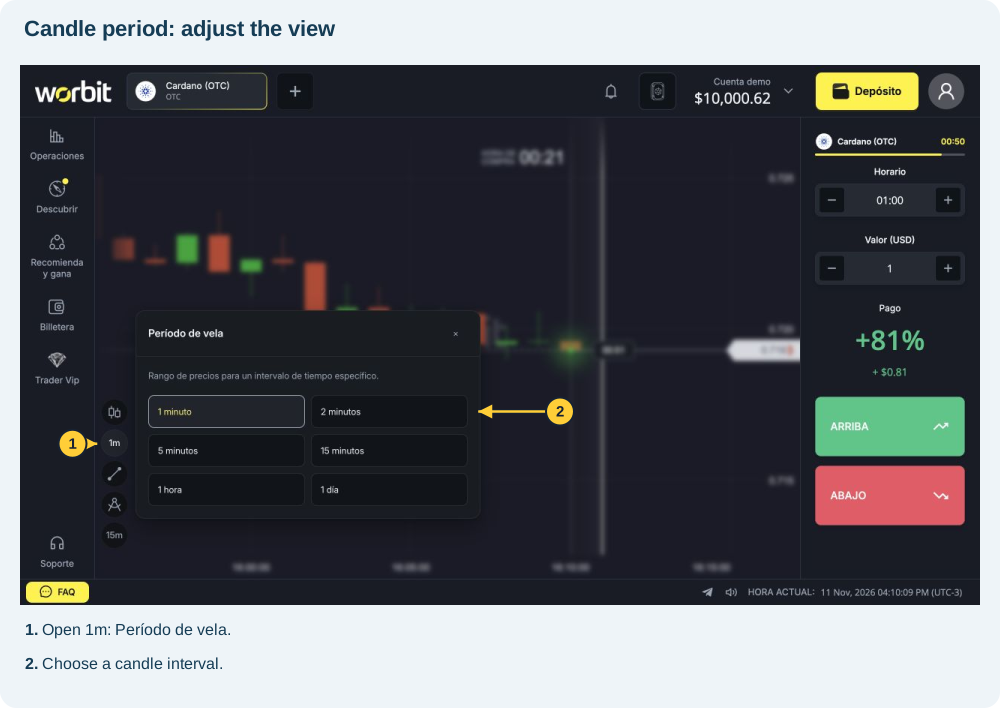
- Find Período de vela (Candle period) in the chart toolbar.
- Check whether you are using 1m, 5m or another available interval.
- Compare candles of the same interval. A five-minute candle summarises more time than a one-minute candle.
- Use a closed candle for a completed reading. The latest candle's body, colour and wicks can still change.
Check the chart type: this explanation concerns conventional candles. Heikin-Ashi uses calculated values; do not read its bodies as directly showing original opening and closing prices.
Long wicks or large bodies describe what happened during that interval. They do not guarantee the next candle's direction or a trade's result.
See also: chart type and candle period · candle period versus trade timing · why a green candle does not mean you won.