
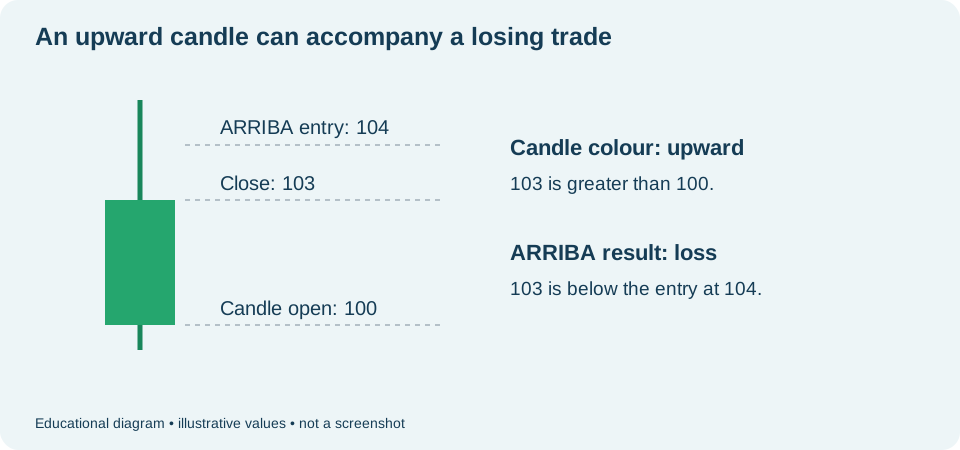
Candle colour compares the close with that candle's own open. A trade's result compares its closing price with your entry price, taking the chosen direction into account. These reference points may differ.
Compare the correct prices
- ARRIBA (Up): a close above entry is the favourable outcome.
- ABAJO (Down): a close below entry is the favourable outcome.
- Candle colour: depends on that candle's open and close, not your entry.
Also check that the candle you are viewing corresponds to the trade's closing interval. The visual chart period may differ from trade duration.
Consider two examples
| Illustrative scenario | Candle colour | Trade result |
|---|---|---|
| The candle opens at 100. You enter ARRIBA at 104. It closes at 103 at the example's expiry. | Rising: 103 is above 100. | Loss: 103 is below the 104 entry. |
| The candle opens at 105. You enter ARRIBA at 100. It closes at 102 at the example's expiry. | Falling: 102 is below 105. | Win: 102 is above the 100 entry. |
For ABAJO, reverse the comparison with entry: a close below entry is favourable. Do not simply reverse the candle colour.
How to check a closed trade
- Open Operaciones (Trades) and find the correct record.
- Check the asset, account and direction.
- Compare the record's opening/entry and closing prices.
- Check the final status and displayed result. Do not rely only on the last candle's appearance.
If it seems different from the chart, check the asset, visible interval and times before assuming an error. If still unsure, send in-platform support the trade ID and a screenshot of its details.
See also: history and results · ties · candle period and trade timing · times and the 30-second rule.