
Bollinger Bands combine a centre line and two bands calculated from the dispersion of closing prices. Their width changes with the data: they may narrow when dispersion is lower and widen as it increases.
How to add them
- Open INDICADORES → Indicadores (Indicators).
- Find Bollinger Bands under Popular or Volatilidad (Volatility).
- Check Período (Period) and Desviación (Deviation). The initial settings observed were 20 and 2.
- Adjust appearance if needed and select Aplicar (Apply).
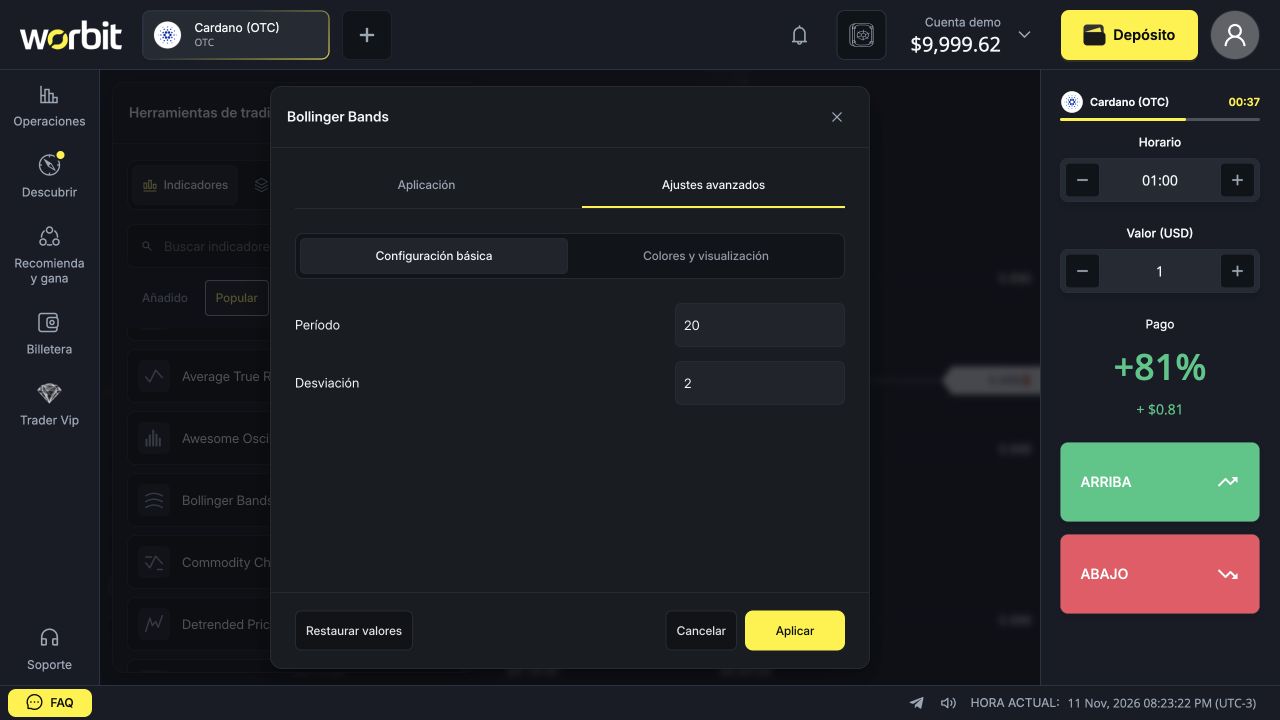
Identify the three lines
- Centre line: the set’s average reference.
- Upper band: a reference above the average.
- Lower band: a reference below the average.
Period changes the analysis window; deviation adjusts the bands’ distance. Colours can be changed, so also recognise the lines by their position.
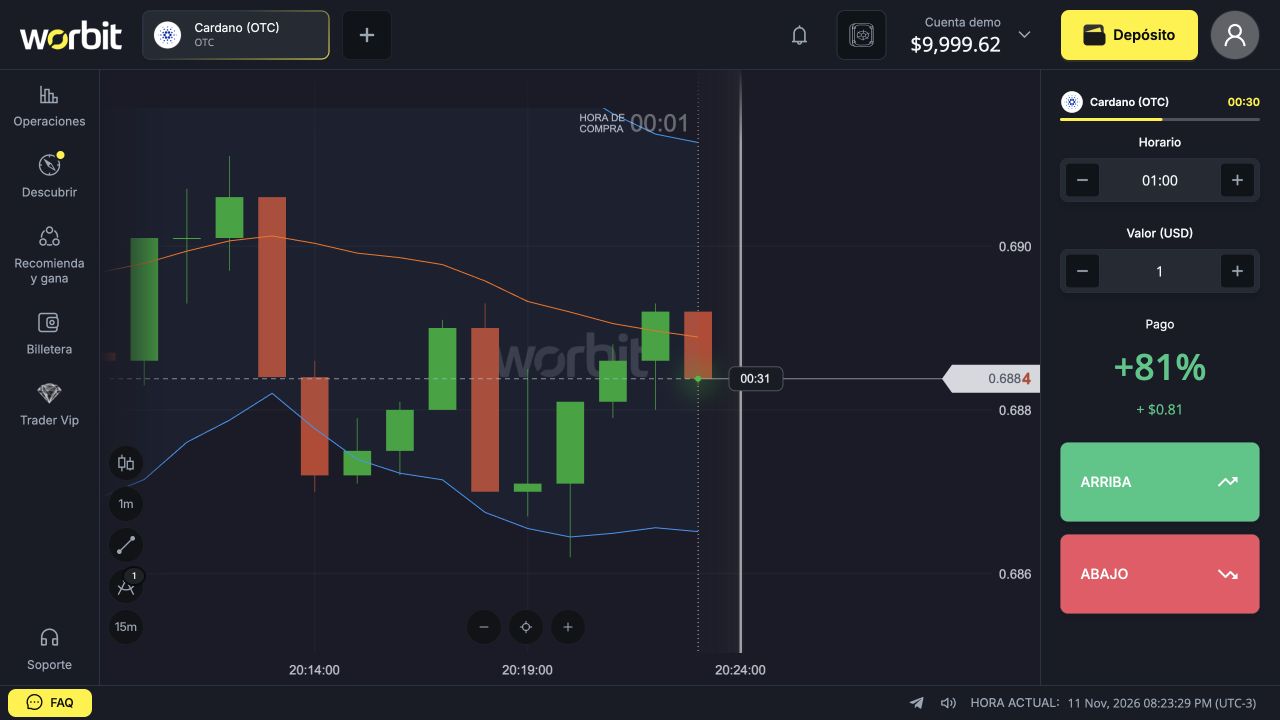
Expansion and contraction
Bands moving closer indicate lower dispersion in the window; moving apart indicates higher dispersion. Contraction alone does not tell you whether the next movement will be upward or downward. Expansion does not guarantee continuation either.
Does touching a band mean reversal?
No. Price can touch a band, cross it or stay near it during a strong movement. Bands are calculated references, not walls preventing new prices. A historical touch does not guarantee a winning outcome on the next trade.
Do not confuse the studies
Bollinger Bands draws the bands; Bollinger Bands %B measures price’s relative position within them; Bollinger Bands Width measures their relative width. These are separate catalogue entries: select the one matching what you want to see.
To edit or remove, use Indicadores → Añadido (Indicators → Added). If a band seems missing, check colours, opacity and chart scale before adding another copy.
See also: indicator guide · ready-made strategies · chart troubleshooting.