
Changing zoom, period, chart type or visibility can substantially change the screen. Start with these checks before adding studies again or deleting settings.
Check the asset and chart type
Check the name at the top, including OTC where present. Then check Tipo de gráfico (Chart type): line, candlesticks and Heikin-Ashi look different. You need to know these conditions to compare screenshots correctly.
Return to the current price
- Find the three navigation controls at the bottom.
- Use Centrar en el precio actual (Centre on current price).
- Use Ampliar (Zoom in) to move closer or Reducir (Zoom out) to show more area.
- If you changed the vertical scale manually, double-click the price axis to restore automatic scaling, as instructed by the interface.
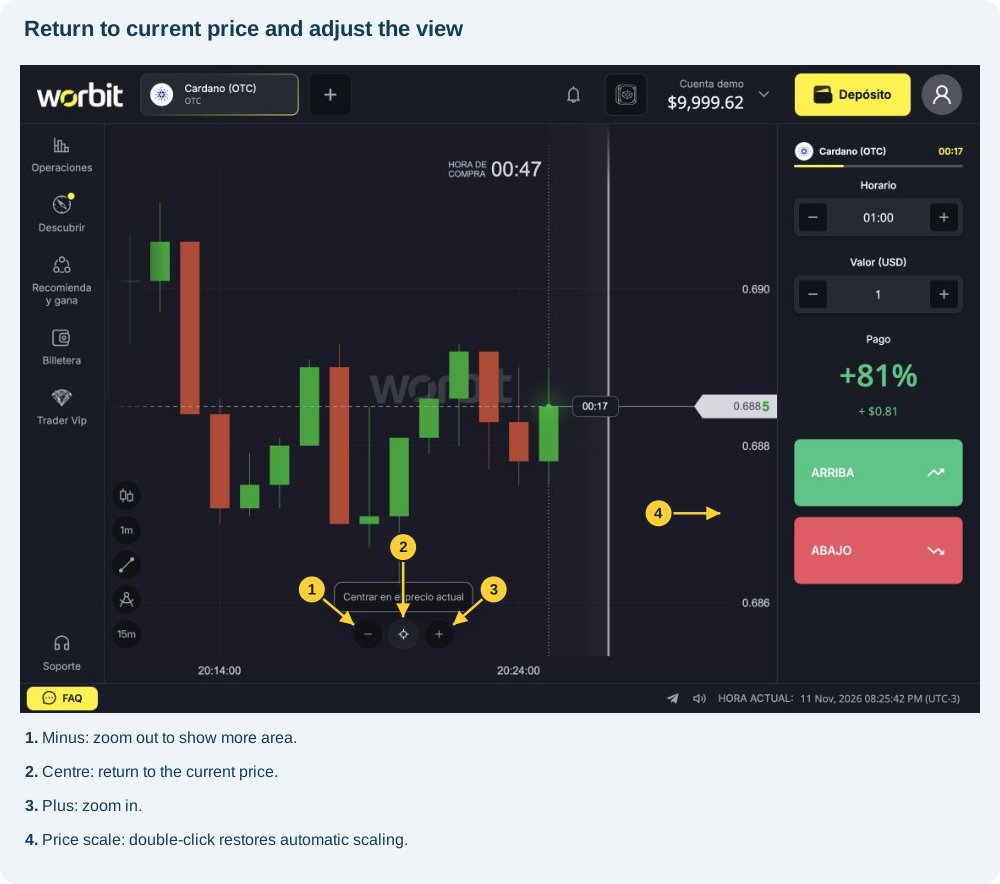
The controls also list keyboard shortcuts: left/right arrows for navigation, plus/minus for zoom and End to return to current price. Use them with focus on the chart, avoiding typing in Horario or Valor fields.
Check the periods
Período de vela (Candle period) changes each candle’s interval; Período (Period) changes the visible window. An indicator’s own period sets how many candles enter its calculation. These settings are separate from Horario (Time), which belongs to the trade.
Has an indicator disappeared?
- Look for it under Indicadores → Añadido (Indicators → Added).
- Check the eye, colour and opacity.
- Look below the candles: RSI and MACD use separate panels.
- Check whether a strategy replaced your previous studies.
- Check that enough history is available for the calculation.
Has a drawing or script disappeared?
A drawing may be hidden or outside the visible area. Return to current price and adjust zoom. Scripts have their own list: check Scripts → Aplicados (Applied). A saved script may remain listed after being removed from the chart.
When to contact support
If the issue continues, provide the asset, chart type, candle period, tool and what happened beforehand. Send a screenshot with context, excluding access credentials. If a trade is under review, include its ID.
A visual difference alone does not prove an error in a result. Check trade details separately. Do not open another trade just to test whether the chart is working.
See also: chart type and candle period · candles and trade duration · indicators · scripts · managing drawings.