
The Scripts tab lets you work with Lua / QCS code to create visual studies. You do not need to program to use the studies in the indicator guide. This tutorial uses Worbit’s own moving-average example.
Open the manual example
- Open INDICADORES → Scripts (Indicators → Scripts).
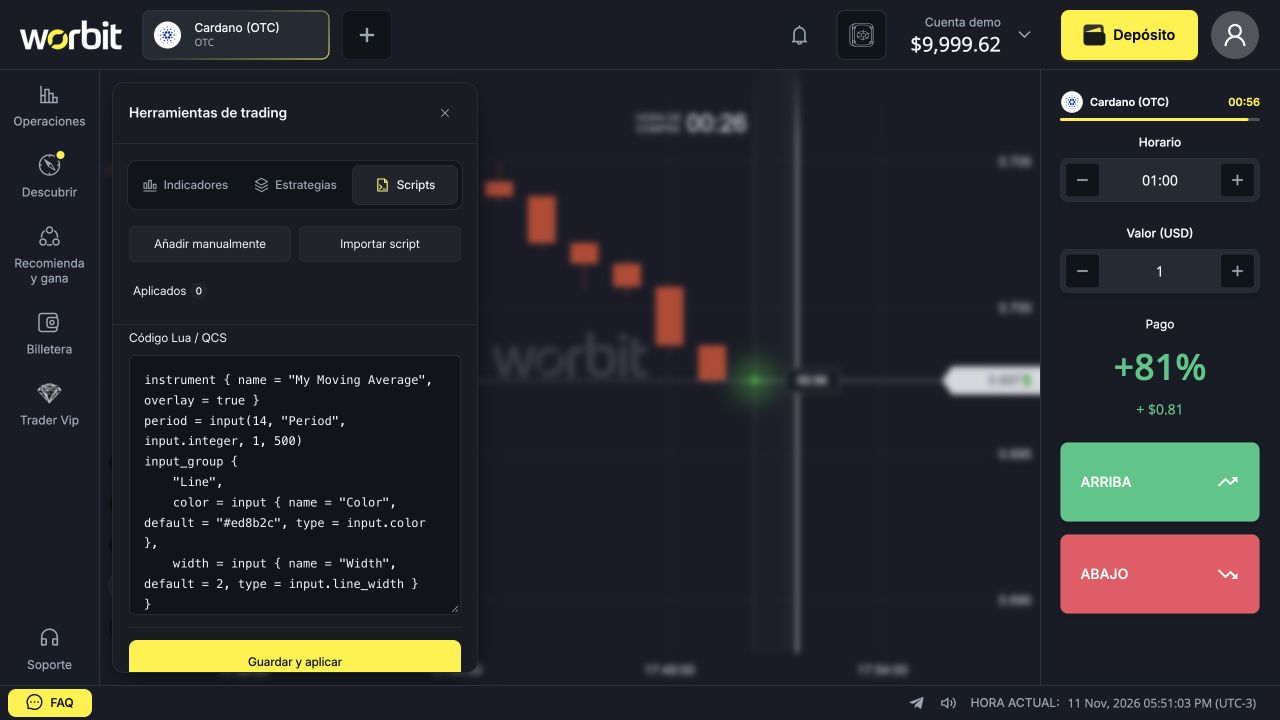
- Select Añadir manualmente (Add manually).
- Look at the Código Lua / QCS editor. The tested version displayed My Moving Average.
- The example defines a simple average, initial period 14 and colour and width options. You can keep it unchanged to learn the process.
Save and apply
- Select Guardar y aplicar (Save and apply).
- Wait for validation. In the test, Validando… (Validating…) appeared before completion.
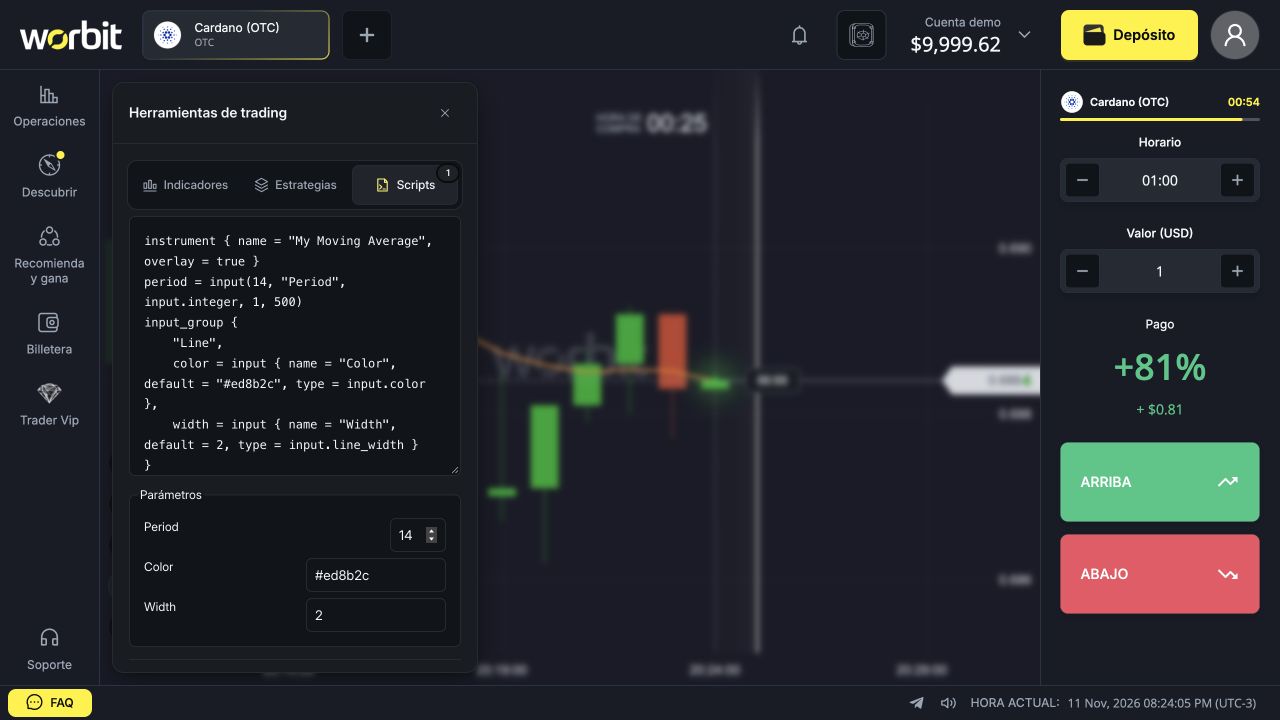
- Check the name in the list, the Aplicados (Applied) count and the line on the chart.
- The example displayed Period, Color and Width. Parameter names depend on the script’s code.
If you change the code, review it and use Guardar y aplicar to validate and apply the edited version. Guardar (Save) is the separate saving option: a name in the list alone does not prove the study is applied.
Removing from the chart differs from deleting
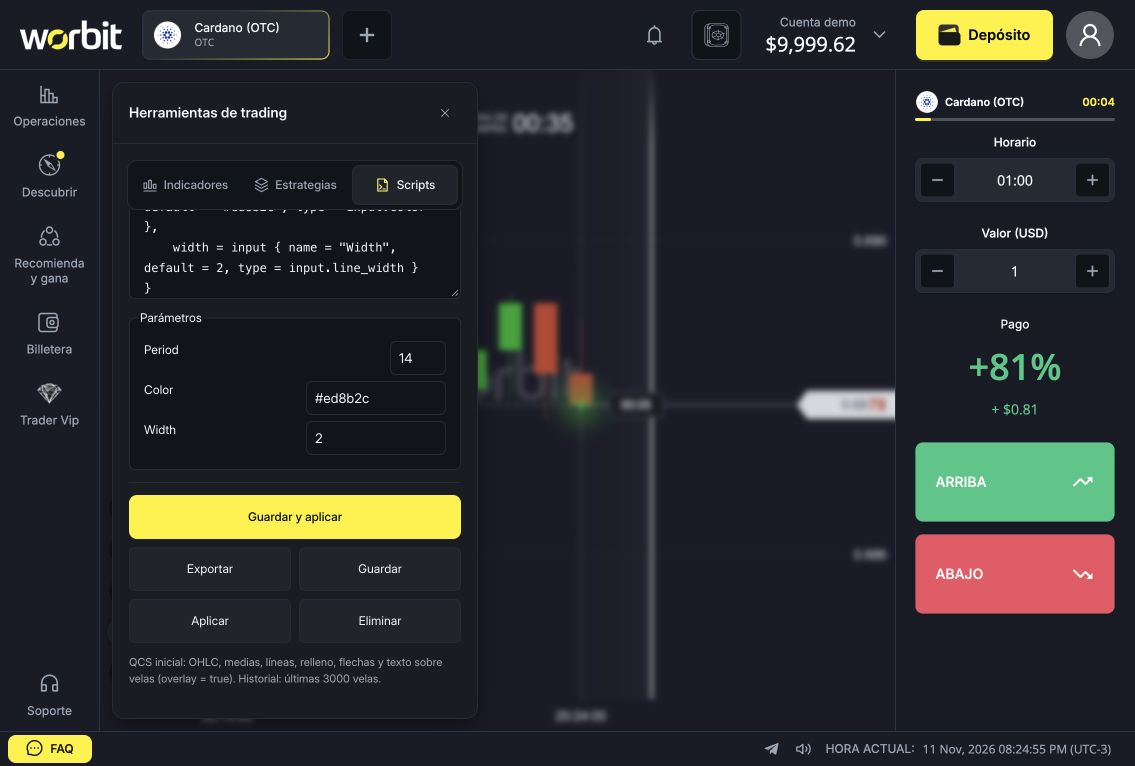
- Quitar del gráfico (Remove from chart): removes the display while keeping the saved script in the list. In the test, Aplicados changed from 1 to 0.
- Aplicar (Apply): lets you reapply a saved script removed from the chart.
- Eliminar (Delete): deletes the saved item. In the test, its name disappeared and the screen again asked for a script to be selected or created.
Before deleting code you want to keep, save a copy in a text file. Do not rely on a recycle bin or undo without checking availability.
Where are import and export?
Importar script (Import script), in Scripts, starts loading a file. Exportar (Export), in the editor, provides a code copy. If the file picker or download does not appear, check browser messages and contact internal support. Avoid repeatedly clicking without knowing whether the action finished.
After loading code, review its content and validation messages before applying it. Lua or QCS in a filename does not prove full compatibility.
Limits and common problems
The interface states initial support for OHLC, averages, lines, fills, arrows and text over candles with overlay = true, using the last 3,000 candles. A study requiring unsupported features or more history may not display as expected.
If an error occurs, record the message, check parameters and try the original example to distinguish a code issue from a general interface issue. When requesting help, provide the script name, asset, candle period and error. Do not include passwords, authentication codes or other access details in code.
A visual script is not a trading robot. Its lines and arrows do not represent submitted orders or guarantee results.
See also: indicator guide · chart troubleshooting.