
Indicators turn chart data into lines, bands, bars or markers that help you study price behaviour. You can use them to observe trends, momentum, volatility and available volume. They do not guarantee a trade’s outcome.
This guide explains how to open the menu and add, configure, hide and remove studies. It includes individual explanations of the 97 indicators available in the version reviewed. We keep their on-screen names to make them easy to find.
Access and add · Configure · Hide and remove · Full catalogue · Scripts and strategies · FAQs
1. How to access and add an indicator
- Enter the trading room and locate the asset’s chart.
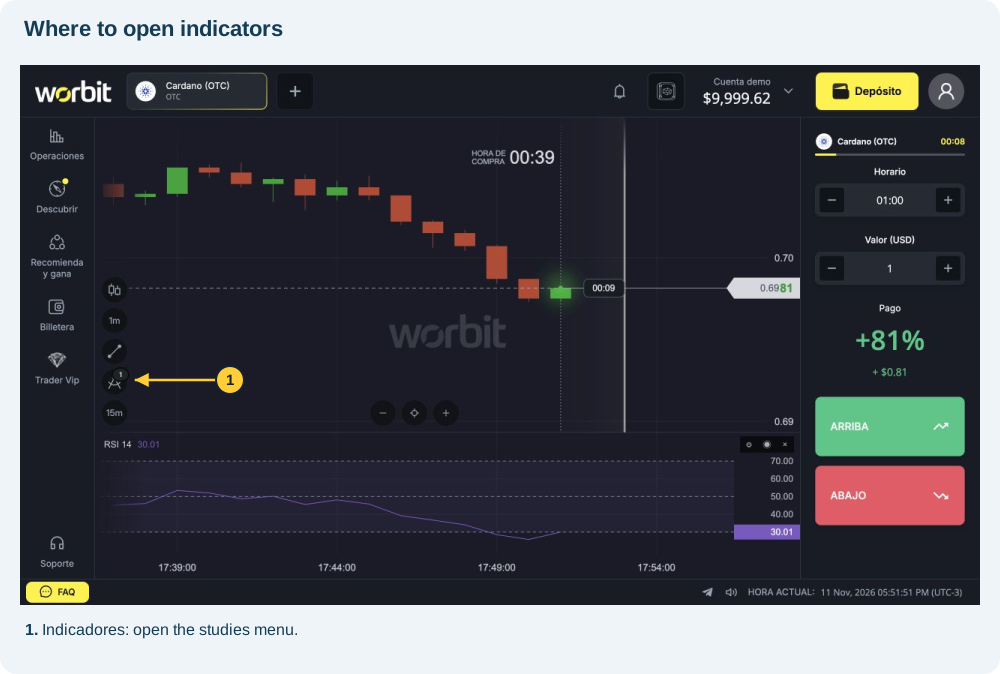
- In the toolbar to the left of the chart, select INDICADORES (Indicators), the icon marked in the image.
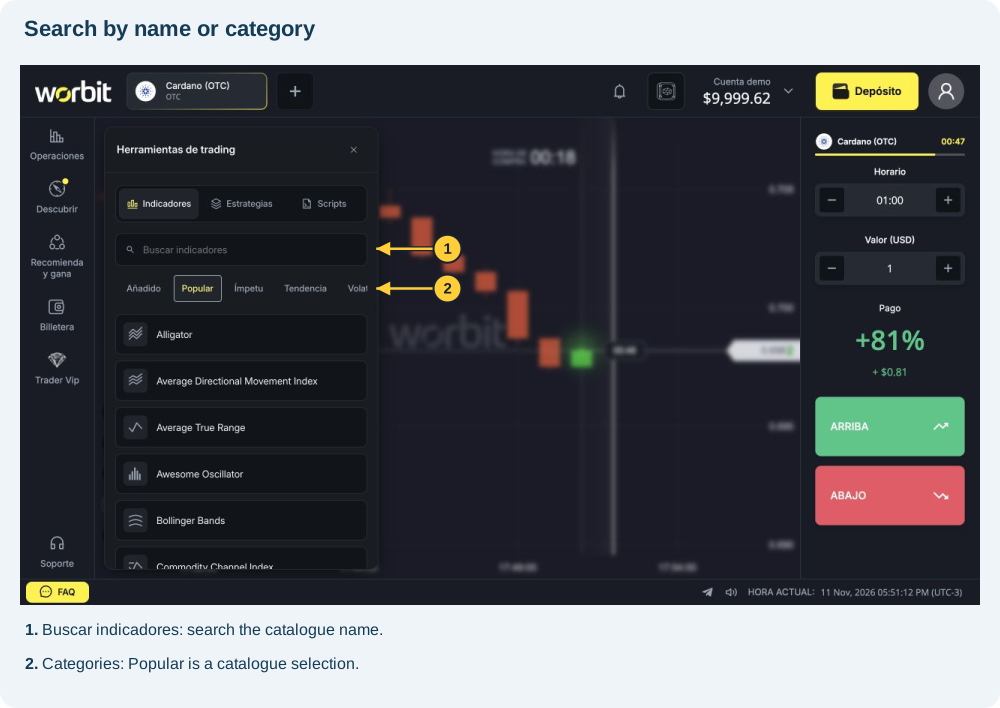
- In Herramientas de trading (Trading tools), keep the Indicadores tab selected.
- Type the name in Buscar indicadores (Search indicators), or choose a category. In narrow windows, scroll along the category row to see the other options.
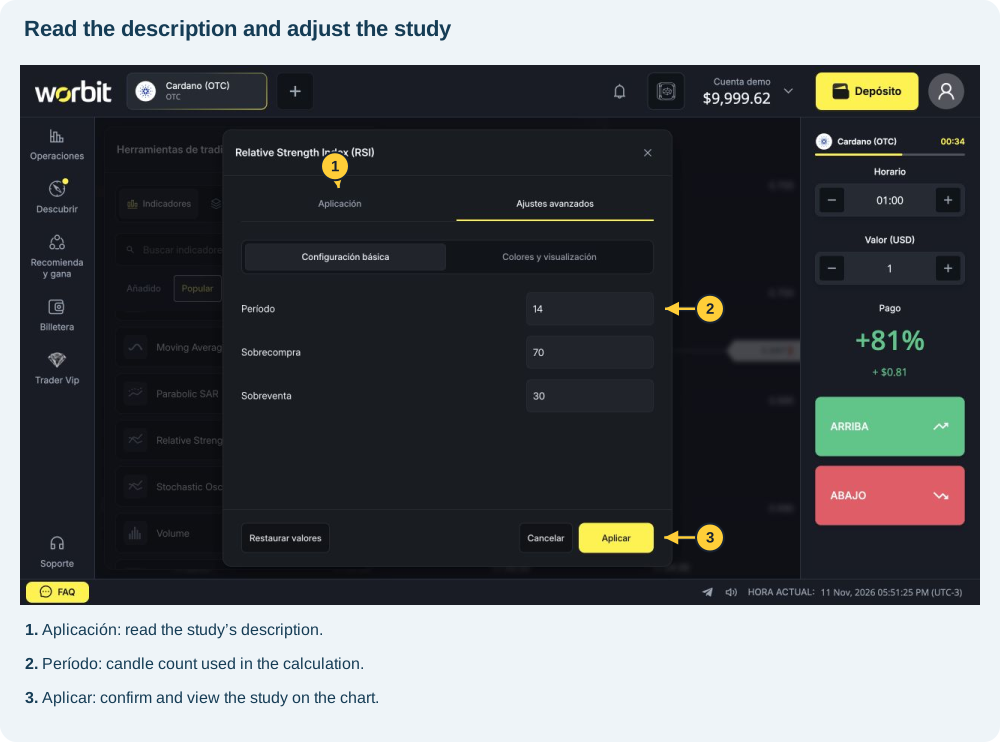
- Select the study. Open Aplicación (Application) to read its description and Ajustes avanzados (Advanced settings) to review parameters.
- Select Aplicar (Apply). The study appears on the chart or in its own panel, depending on its type. In the RSI test, it appeared below the candles.
Guided example: find Relative Strength Index (RSI). The initial settings observed were period 14, overbought 70 and oversold 30. You can keep these values to learn the interface; they are example parameters, not settings that guarantee winning trades.
2. How to configure and edit
Open Indicadores → Añadido (Indicators → Added) and select the edit icon on the study’s row. The RSI panel also has a cog beside its name. Adjust the fields and select Aplicar (Apply). Cancelar (Cancel) exits without confirming the edit.
- Aplicación: explains the calculation or purpose.
- Ajustes avanzados → Configuración básica (Advanced settings → Basic settings): contains study-specific parameters.
- Colores y visualización (Colours and display): adjusts appearance. RSI offered line colours, opacity and widths of 1, 2 and 3 px.
- Restaurar valores (Restore values): restores defaults; review the fields before applying.
What do the main fields mean?
- Período (Period): number of candles used in the calculation. With 1-minute candles, 14 periods means 14 one-minute candles; with 5-minute candles, it means 14 five-minute candles. This does not set trade duration.
- Fuente (Source): the price used. Cierre is close; Apertura is open; Máximo and Mínimo are high and low. Formula options combine these prices: OHLC / 4 averages open, high, low and close.
- Método (Method): how the reference is calculated. SMA is simple; EMA, exponential; SSMA, smoothed; WMA, weighted; TMA, triangular; HMA, Hull; MEDIAN uses the median. No method is universally best.
- Período rápido/lento, Suavizado and Señal (Fast/slow period, Smoothing and Signal): control different windows and smoothing. Smoothing reduces fluctuations but may slow the response.
- Sobrecompra/Sobreventa (Overbought/Oversold): oscillator reference levels, not orders or guarantees of a reversal.
- Multiplicador and Desviación (Multiplier and Deviation): change band distance or width. Check the unit: % and ‰ differ.
- Desplazamiento (Offset): may shift a line in time or have a study-specific meaning. Read the full label: ZigZag’s “Desplazamiento (%)” is not the same field as a shifted average’s offset.
Distinguish three controls: indicator period selects how many candles enter the calculation; Período de vela sets the time each candle represents; Horario relates to the trade. See candle period and trade duration.
3. How to hide, show and remove
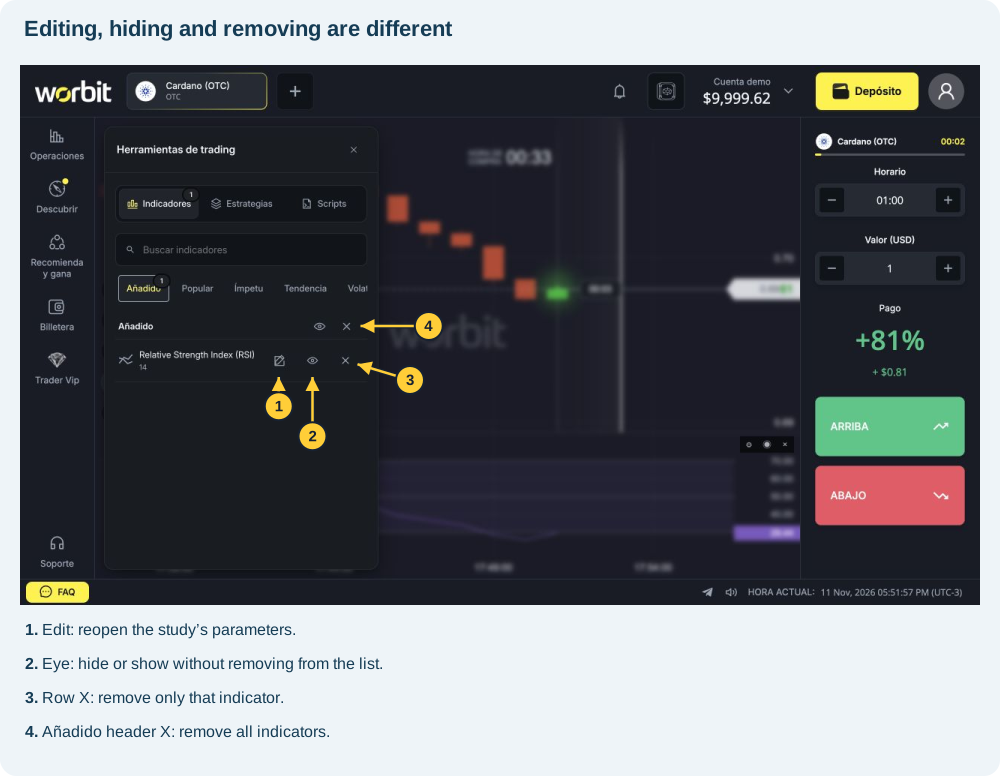
- Open INDICADORES → Añadido, which lists your added studies.
- Select the row’s eye to hide the indicator. It stays in the list; select the eye again to show it.
- To remove it, select the X on its own row. In the RSI test, removal was immediate and the study disappeared from the panel.
- To add it again, find it in the catalogue and configure it again.
The Añadido header also has visibility and removal controls for all indicators. Distinguish a row’s X from the header’s X. The top X in Herramientas de trading only closes that menu.
Removing an indicator removes the study from the chart. It does not cancel an open trade or return its amount. See Can I cancel a trade after opening it?.
4. All Worbit indicators
The catalogue keeps the interface’s categories. Popular contains 16 shortcuts and repeats studies from other categories. To avoid duplicates, we list the 93 studies in the five categories, followed by the four additional Popular entries: Alligator, Volume and both Volume Profiles.
How to read this catalogue: each entry explains what the study shows and what it can help with. Configuration fields retain their Spanish names. A field’s presence does not replace the description of the study’s specific calculation.
Ímpetu (Momentum) — 31 indicators
Aroon Oscillator
Shows the difference between Aroon’s upward and downward lines. It helps compare which side dominates recent extremes; readings can change quickly in sideways markets.
Fields: Período. Adjust appearance under Colores y visualización (Colours and display).
Awesome Oscillator
Compares fast and slow averages of the midpoint price. Its histogram shows momentum changes; crossing zero does not guarantee the direction of the next trade.
Fields: Período lento; Período. Adjust appearance under Colores y visualización (Colours and display).
Balance of Power
Relates the candle body to its high–low range. It helps show upward or downward pressure without directly counting buyers or sellers.
Fields: Método; Período. Adjust appearance under Colores y visualización (Colours and display).
Belkhayate Timing
On Worbit, it shows candles normalised by the average and historical range. It compares current movement with a recent reference; an extreme does not determine when a reversal will occur.
Fields: Período. Adjust appearance under Colores y visualización (Colours and display).
Center of Gravity
Calculates a weighted centre of gravity of the midpoint price and a lagged version. It helps study fluctuations and changes in pace; both lines depend on prices already observed.
Fields: Período. Adjust appearance under Colores y visualización (Colours and display).
Chande Forecast Oscillator
Measures the price’s relative distance from linear regression. It helps show whether price is above or below that statistical reference; “Forecast” does not mean a guaranteed prediction.
Fields: Fuente; Período. Adjust appearance under Colores y visualización (Colours and display).
Chande Momentum Oscillator
Compares net upward and downward changes with total movement. It helps assess the balance of buying and selling momentum over the selected window.
Fields: Fuente; Período. Adjust appearance under Colores y visualización (Colours and display).
DeMarker
Compares increases in highs with decreases in lows. It helps show relative pressure and extreme areas, which may persist while movement continues.
Fields: Período. Adjust appearance under Colores y visualización (Colours and display).
Detrended Price Oscillator (DPO)
Subtracts the period average from a shifted price. It helps study cycles by reducing the trend’s effect; account for the shift when comparing it with the current candle.
Fields: Fuente; Método; Período. Adjust appearance under Colores y visualización (Colours and display).
Divergence Indicator
Identifies divergences between confirmed turning points in price and RSI. It helps locate movements that no longer agree; confirmation needs candles after the point being analysed.
Fields: Período. Adjust appearance under Colores y visualización (Colours and display).
Gator Oscillator
Shows distances between Alligator’s three shifted averages. It helps track their expansion and contraction rather than interpreting each average separately.
Fields: Dientes: período; Labios: período; Mandíbula: desplazamiento; Dientes: desplazamiento; Labios: desplazamiento; Período. Adjust appearance under Colores y visualización (Colours and display).
Intraday Momentum Index
Compares upward candle bodies with total body movement. It helps assess the predominance of upward moves; it does not use RSI’s comparison between closing prices.
Fields: Período. Adjust appearance under Colores y visualización (Colours and display).
Know Sure Thing
Combines four smoothed rates of change with different weights. It helps observe momentum across several horizons; its name does not imply a certain outcome.
Fields: Período de señal; Período. Adjust appearance under Colores y visualización (Colours and display).
MACD
Shows the difference between exponential averages, a signal line and a histogram. It helps observe direction and momentum changes; crossings may repeat without a consistent trend.
Fields: Período; Período lento; Señal. Adjust appearance under Colores y visualización (Colours and display).
Momentum
On Worbit, it shows the price difference between the current close and the close N periods ago. It helps compare price advances or declines; the value is not a percentage.
Fields: Período. Adjust appearance under Colores y visualización (Colours and display).
Pretty Good Oscillator
Compares the price’s distance from its average with true range. It helps assess whether that distance is large relative to recent fluctuations, without guaranteeing a return to the average.
Fields: Período. Adjust appearance under Colores y visualización (Colours and display).
Price Momentum Oscillator
Applies two smoothing stages to the rate of change and includes a signal line. It helps track momentum changes with fewer short fluctuations, although the response may be slower.
Fields: Período de suavizado; Período de señal; Período. Adjust appearance under Colores y visualización (Colours and display).
Price Oscillator
Shows the percentage difference between exponential averages and a signal line. It helps compare their separation; it differs from Momentum, which uses a price difference rather than a percentage.
Fields: Fuente; Período lento; Período de señal; Período. Adjust appearance under Colores y visualización (Colours and display).
Rainbow Oscillator
Compares price with a sequence of ten moving averages. It helps visualise its distance from several smoothed references; it does not represent ten independent confirmations.
Fields: Período largo; Período. Adjust appearance under Colores y visualización (Colours and display).
Rate of Change
Shows the percentage change in the close compared with N periods ago. It helps measure the relative size of a rise or fall; the selected window changes the comparison.
Fields: Período. Adjust appearance under Colores y visualización (Colours and display).
Relative Strength Index (RSI)
Compares smoothed gains and losses on a scale from 0 to 100. It helps observe relative strength and extreme areas; moving above 70 or below 30 is not an automatic entry order.
Fields: Período; Sobrecompra; Sobreventa. Adjust appearance under Colores y visualización (Colours and display).
Schaff Trend Cycle
Normalises MACD twice through stochastic cycles. It helps track momentum phases on an oscillating scale; readings may remain in extreme areas.
Fields: Período rápido; Período lento; Período. Adjust appearance under Colores y visualización (Colours and display).
Special K
Combines short, medium and long cycles. It helps analyse momentum across several horizons, but needs extensive history for a useful reading.
Fields: Período de suavizado; Período. Adjust appearance under Colores y visualización (Colours and display).
Stochastic Momentum Index
Measures the close’s distance from the centre of the price range, with double smoothing. It helps assess its position relative to that midpoint; it differs from the traditional stochastic oscillator.
Fields: Período de suavizado; Período de señal; Período. Adjust appearance under Colores y visualización (Colours and display).
Stochastic Oscillator
Locates the close within the high–low range and shows %K and %D lines. It helps observe position and pace; staying near the top does not force price to fall.
Fields: Período; Suavizado; Señal; Sobrecompra; Sobreventa. Adjust appearance under Colores y visualización (Colours and display).
TRIX
Worbit describes it as measuring changes in the price logarithm smoothed three times. It helps filter short movements and observe more persistent momentum; filtering can also delay signals.
Fields: Fuente; Período. Adjust appearance under Colores y visualización (Colours and display).
True Strength Index
Smooths momentum twice and compares it with absolute movement. It helps assess momentum’s direction and consistency without eliminating false fluctuations.
Fields: Fuente; Período corto; Período de señal; Período. Adjust appearance under Colores y visualización (Colours and display).
Ultimate Oscillator
Combines buying pressure over three periods with different weights. It helps compare momentum across more than one window without turning agreement into a guarantee.
Fields: Período medio; Período largo; Período. Adjust appearance under Colores y visualización (Colours and display).
Vortex Indicator
Compares movements between highs and lows with true range. It helps track the relative predominance of upward and downward movements.
Fields: Período. Adjust appearance under Colores y visualización (Colours and display).
Williams’ Percent Range
Locates the close within the historical range on a scale from −100 to zero. It helps identify proximity to extremes; values near zero mean the close is near the window’s high.
Fields: Período. Adjust appearance under Colores y visualización (Colours and display).
Woodies CCI
Combines fast and slow CCI with a trend histogram. It helps compare short movements with a slower reference; both readings derive from the same prices.
Fields: Período rápido; Período. Adjust appearance under Colores y visualización (Colours and display).
Tendencia (Trend) — 25 indicators
Aroon
Measures time since the period’s highs and lows. It helps observe the frequency of new extremes; it measures recency, not the size of a rise or fall.
Fields: Período. Adjust appearance under Colores y visualización (Colours and display).
ATR Trailing Stops
Draws a moving reference based on average true range. It helps visualise levels that follow volatility; it does not create a stop order or cancel a trade.
Fields: Multiplicador; Período. Adjust appearance under Colores y visualización (Colours and display).
Average Directional Movement Index
Combines smoothed directional strength with DI+ and DI− lines. ADX shows intensity; the directional lines help distinguish the sides. A high ADX alone does not mean price is rising.
Fields: Período de suavizado; Período. Adjust appearance under Colores y visualización (Colours and display).
Bollinger Bands %B
Shows the price’s relative position within Bollinger Bands. It helps compare proximity to the bands and moves beyond them; do not confuse it with band width.
Fields: Fuente; Período; Desviación. Adjust appearance under Colores y visualización (Colours and display).
Chop Zone
Uses colours derived from the normalised slope of an exponential average. It helps visualise changes in behaviour; a colour change does not confirm a future reversal.
Fields: Período de media; Período. Adjust appearance under Colores y visualización (Colours and display).
Commodity Channel Index
Compares typical price with its average, adjusting for mean deviation. It helps identify relative distances and momentum changes, including in assets other than commodities.
Fields: Período. Adjust appearance under Colores y visualización (Colours and display).
Darvas Box
Forms boxes from breakouts and subsequent confirmation of highs. It helps visualise ranges and their boundaries; confirmation may require new candles.
Fields: Período. Adjust appearance under Colores y visualización (Colours and display).
Disparity Index
Measures the percentage distance between price and an average. It helps compare relative separation; it does not determine when price will return to the average.
Fields: Fuente; Método; Período. Adjust appearance under Colores y visualización (Colours and display).
Ehler Fisher Transform
Applies a statistical transformation to the normalised midpoint price. It helps highlight extremes and changes in the series; highlighted peaks can still produce false signals.
Fields: Período. Adjust appearance under Colores y visualización (Colours and display).
Elder Impulse System
Colours candles according to the direction of the exponential average and MACD histogram. It helps visualise agreement between trend and momentum; colours do not represent a trade’s outcome.
Fields: Período rápido; Período lento; Período de señal; Período. Adjust appearance under Colores y visualización (Colours and display).
Fractals
Marks local highs and lows confirmed by closed candles to their right. It helps locate reference points; a mark may appear on a past candle only after confirmation.
Fields: Período. Adjust appearance under Colores y visualización (Colours and display).
Ichimoku Cloud
Combines equilibrium lines and a cloud shifted in time. It helps visualise trends and reference areas; the shifted cloud uses existing data, not future prices.
Fields: Período lento; Período largo; Desplazamiento; Período. Adjust appearance under Colores y visualización (Colours and display).
KDJ
Combines stochastic K and D lines with J, calculated as 3K minus 2D. It helps highlight momentum changes; J may react more strongly than the other lines.
Fields: Período de suavizado; Período de señal; Período. Adjust appearance under Colores y visualización (Colours and display).
Linear Regression Forecast
Shows the endpoint of linear regression over the selected window. It helps compare price with a statistically fitted line; its name does not guarantee the next price.
Fields: Fuente; Período. Adjust appearance under Colores y visualización (Colours and display).
Linear Regression Slope
Measures the regression line’s slope. It helps observe the direction and intensity of the historical slope; its scale depends on prices and the selected window.
Fields: Fuente; Período. Adjust appearance under Colores y visualización (Colours and display).
Mass Index
Sums the ratio between the range smoothed once and twice. It helps observe range expansion and contraction, but does not determine movement direction on its own.
Fields: Período EMA; Período. Adjust appearance under Colores y visualización (Colours and display).
McGinley Dynamic
Uses a dynamic average adjusted by the relationship between price and the previous value. It helps follow price with an adaptive response; it remains a historical reference.
Fields: Fuente; Período. Adjust appearance under Colores y visualización (Colours and display).
Parabolic SAR
Draws stop-and-reversal reference points with configurable acceleration. It helps track direction changes; the points are not orders and do not close trades.
Fields: Aceleración inicial; Incremento de aceleración; Aceleración máxima; Período. Adjust appearance under Colores y visualización (Colours and display).
Qstick
Averages the difference between close and open. It helps observe the predominance of upward or downward bodies; it does not directly measure trading volume.
Fields: Período. Adjust appearance under Colores y visualización (Colours and display).
Random Walk Index
Compares movements with the range expected in a random walk. It helps assess whether they stand out from that statistical reference; it does not prove predictability.
Fields: Período. Adjust appearance under Colores y visualización (Colours and display).
Relative Vigor Index
Relates smoothed candle bodies to candle ranges. It helps assess the close’s vigour relative to the open and the range covered.
Fields: Período. Adjust appearance under Colores y visualización (Colours and display).
Supertrend
Tracks the trend with ATR-based bands. It helps visualise reference changes with price and volatility; frequent alternations may occur in sideways markets.
Fields: Multiplicador; Período. Adjust appearance under Colores y visualización (Colours and display).
Trend Intensity Index
Measures the proportion of positive deviations from the average. It helps observe how much the set of prices remains above that reference.
Fields: Período corto; Período. Adjust appearance under Colores y visualización (Colours and display).
Vertical Horizontal Filter
Compares the period’s range with the sum of absolute changes. It helps distinguish directional movement from back-and-forth fluctuations, without indicating upward or downward direction on its own.
Fields: Período. Adjust appearance under Colores y visualización (Colours and display).
ZigZag
Connects confirmed percentage reversals and simplifies movements. It helps study peaks and troughs; the final leg is provisional and may change as price develops.
Fields: Desplazamiento (%); Período. Adjust appearance under Colores y visualización (Colours and display).
Volatilidad (Volatility) — 13 indicators
ATR Bands
Draws bands around price using average true range. It helps visualise volatility-adjusted areas; touching a band does not guarantee a reversal.
Fields: Fuente; Multiplicador; Período. Adjust appearance under Colores y visualización (Colours and display).
Average True Range
Measures smoothed true range, including differences from the previous close. It helps assess how much price fluctuates; a higher ATR does not necessarily indicate a price rise.
Fields: Período. Adjust appearance under Colores y visualización (Colours and display).
Bollinger Bands
Combines an average with bands based on closing-price standard deviation. It helps observe dispersion and expansion or contraction; price may continue beyond a band.
Fields: Período; Desviación. Adjust appearance under Colores y visualización (Colours and display).
Chaikin Volatility
Measures changes in the exponential average of the high–low difference. It helps track range changes; it does not represent volume or direction by itself.
Fields: Período ROC; Período. Adjust appearance under Colores y visualización (Colours and display).
Donchian Channels
Forms a channel using the period’s high and low and a centre line. It helps visualise historical boundaries; a breakout may fail.
Fields: Período. Adjust appearance under Colores y visualización (Colours and display).
Donchian Width
Measures the width of the previous candle’s Donchian channel. It helps compare expansion and contraction; greater width does not indicate the next direction.
Fields: Período. Adjust appearance under Colores y visualización (Colours and display).
Gopalakrishnan Range Index
Relates the logarithm of the historical range to the logarithm of the period. It helps compare range with window size; it measures behaviour rather than predicting direction.
Fields: Período. Adjust appearance under Colores y visualización (Colours and display).
High Low Bands
Draws percentage bands around a triangular average. It helps visualise distances from that average; the configured distance changes the width.
Fields: Fuente; Desplazamiento (%); Período. Adjust appearance under Colores y visualización (Colours and display).
Historical Volatility
Calculates the dispersion of logarithmic returns with configurable annualisation. It helps compare historical fluctuations; the annual factor must suit the series and does not predict future volatility.
Fields: Fuente; Factor anual; Período. Adjust appearance under Colores y visualización (Colours and display).
Keltner Channels
Forms a typical-price channel with ATR-based bands. It helps track range-adjusted bands; its construction differs from Bollinger Bands.
Fields: Multiplicador; Período. Adjust appearance under Colores y visualización (Colours and display).
Relative Volatility
Compares smoothed deviations of upward and downward movements. It helps observe how volatility is distributed between the sides; it is not the same indicator as RSI.
Fields: Fuente; Período de suavizado; Período. Adjust appearance under Colores y visualización (Colours and display).
Standard Deviation
Measures sample dispersion of prices around the average. It helps observe how far values deviate from the reference; greater dispersion does not define direction.
Fields: Fuente; Método; Período. Adjust appearance under Colores y visualización (Colours and display).
STARC Bands
Combines a moving average with ATR bands and a multiplier. It helps visualise a range-adjusted area around the average; bands are not compulsory price boundaries.
Fields: Fuente; Período de media; Multiplicador; Período. Adjust appearance under Colores y visualización (Colours and display).
Medias móviles (Moving averages) — 7 indicators
Arnaud Legoux Moving Average (ALMA)
Uses Gaussian weights, offset and sigma to construct the average. It helps smooth price with adjustable weights; changing those parameters changes its response.
Fields: Fuente; Desplazamiento; Sigma; Período. Adjust appearance under Colores y visualización (Colours and display).
Envelopes
Draws bands at a distance from the moving average. It helps visualise separation; check the unit in “Desviación (‰)”: per mille is not the same as percent.
Fields: Fuente; Método; Desviación (‰); Período. Adjust appearance under Colores y visualización (Colours and display).
Kaufman’s Adaptive Moving Average (KAMA)
Adapts the average according to the efficiency of price movement. It helps vary the response between more directional movements and irregular fluctuations.
Fields: Fuente; Período rápido; Período lento; Período. Adjust appearance under Colores y visualización (Colours and display).
Least Squares Moving Average (LSMA)
Uses least-squares linear regression as a moving reference. It helps track the statistical fit of prices; the configurable offset adds no future information.
Fields: Fuente; Desplazamiento; Período. Adjust appearance under Colores y visualización (Colours and display).
Moving Average
Calculates a smoothed reference with selectable method and source. It helps observe direction and price position relative to the average; shorter periods usually respond faster.
Fields: Fuente; Método; Período. Adjust appearance under Colores y visualización (Colours and display).
Moving Average Deviation
Shows a histogram of the difference between price and average. It helps show which side price is on and how far it has moved away, without guaranteeing a return.
Fields: Fuente; Método; Período. Adjust appearance under Colores y visualización (Colours and display).
Rainbow Moving Averages
Shows a sequence of successively smoothed averages. It helps visualise alignment and dispersion between references; many similar lines do not constitute independent evidence.
Fields: Fuente; Método; Número de medias; Período. Adjust appearance under Colores y visualización (Colours and display).
Otros (Other) — 17 indicators
Accumulative Swing Index
Accumulates Swing Index values. It helps observe the combined evolution of measured fluctuations; the cumulative scale differs from an individual reading.
Fields: Límite de movimiento; Período. Adjust appearance under Colores y visualización (Colours and display).
Bollinger Bands Width
Measures band width relative to the average. It helps identify contraction or expansion; it differs from %B, which measures price position within the bands.
Fields: Fuente; Método; Período; Desviación. Adjust appearance under Colores y visualización (Colours and display).
Chande Kroll Stop
Calculates moving levels using extremes and ATR. It helps visualise movement-adjusted references; despite “Stop” in its name, it does not place or execute a protective order.
Fields: Multiplicador; Período corto; Período. Adjust appearance under Colores y visualización (Colours and display).
Choppiness Index
Logarithmically compares accumulated true range with the total range. It helps observe sideways or directional behaviour; it does not choose a trade’s direction.
Fields: Período. Adjust appearance under Colores y visualización (Colours and display).
Coppock Curve
Applies a weighted average to the sum of two rates of change. It helps observe momentum changes in a smoothed series; readings depend on the configured windows.
Fields: Fuente; Período largo; Período corto; Período. Adjust appearance under Colores y visualización (Colours and display).
Elder Ray Index
Compares upward and downward forces with an exponential average. It helps observe the distance of highs and lows from that reference without measuring actual participant numbers.
Fields: Período. Adjust appearance under Colores y visualización (Colours and display).
Fractal Chaos Bands
Creates a channel using the latest fractals confirmed after two candles. It helps visualise confirmed levels; new marks depend on that waiting period.
Fields: Período. Adjust appearance under Colores y visualización (Colours and display).
Fractal Chaos Oscillator
Shows the difference between confirmed high and low fractals. It helps compare extremes recognised by the calculation; it does not anticipate confirmation of new fractals.
Fields: Período. Adjust appearance under Colores y visualización (Colours and display).
High - Low
Shows the difference between each candle’s high and low. It helps compare fluctuation size; a wide-range candle may close upward or downward.
Fields: Período. Adjust appearance under Colores y visualización (Colours and display).
Highest High
Shows the highest high of the previous period. It helps visualise a historical extreme as a reference; that level does not prevent higher prices.
Fields: Período. Adjust appearance under Colores y visualización (Colours and display).
Linear Regression Intercept
Projects the regression to the start of the historical window. It helps study the fitted line’s position at that point; it differs from the endpoint shown by Linear Regression Forecast.
Fields: Fuente; Período. Adjust appearance under Colores y visualización (Colours and display).
Linear Regression R2
Shows the regression’s coefficient of determination, from zero to one. It helps assess the line’s fit to the data; a high value does not indicate direction or guarantee continuation.
Fields: Fuente; Período. Adjust appearance under Colores y visualización (Colours and display).
Lowest Low
Shows the lowest low of the previous period. It helps visualise a historical extreme as a reference; that level does not prevent lower prices.
Fields: Período. Adjust appearance under Colores y visualización (Colours and display).
Psychological Line
Shows the percentage of candles that closed above the previous close. It helps measure the frequency of rises; it does not measure their size or participants’ actual psychology.
Fields: Período. Adjust appearance under Colores y visualización (Colours and display).
Shinohara Intensity Ratio
Compares ratios involving highs, lows, opens and previous closes. It helps study relative movement intensity; it does not directly count orders.
Fields: Período. Adjust appearance under Colores y visualización (Colours and display).
Swing Index
Calculates a swing index with a configurable movement limit. It helps summarise relationships between candle prices; the selected limit changes the scale.
Fields: Límite de movimiento; Período. Adjust appearance under Colores y visualización (Colours and display).
Ulcer Index
Summarises percentage drawdowns from recent highs using a root mean square. It helps assess historical drawdown intensity; it differs from volatility measures that treat rises and falls similarly.
Fields: Fuente; Período. Adjust appearance under Colores y visualización (Colours and display).
Additional Popular entries — 4 indicators
Alligator
Combines three smoothed averages shifted in time. Their convergence or separation helps show directionless periods and more defined movements; the visual offset does not predict future prices.
Fields: Dientes: período; Labios: período; Mandíbula: desplazamiento; Dientes: desplazamiento; Labios: desplazamiento; Período. Adjust appearance under Colores y visualización (Colours and display).
Volume
Shows volume reported by the provider for each candle. It helps compare activity recorded by that source; it does not represent global market volume or Worbit’s customer count.
Fields: Media móvil del volumen; Período. Adjust appearance under Colores y visualización (Colours and display).
Volume Profile Fixed Range
Distributes volume by price level between two chart points. After applying it, select both points. It helps observe concentrations in that segment; it depends on the provider’s data.
Fields: Disposición de filas; Tamaño de fila; Volumen; Área de valor (%). Adjust appearance under Colores y visualización (Colours and display).
Volume Profile Visible Range
Distributes volume by price within the visible chart range. It helps study concentrations on screen; changing the visible range may change the profile.
Fields: Disposición de filas; Tamaño de fila; Volumen; Área de valor (%). Adjust appearance under Colores y visualización (Colours and display).
Volume Profile: understanding the options
In both profiles, Disposición de filas (Row layout) lets you use a number of rows or ticks per row; Tamaño de fila (Row size) adjusts the division. Volumen offers Alza / baja (Up/down), Total and Delta. Área de valor (%) (Value area) sets the percentage used in that area. Consider how volume is classified and where the data comes from before interpreting “Delta” as actual order flow.
For Fixed Range, the window tells you to select two points after applying. Visible Range uses the visible interval. Do not confuse volume per candle with volume distributed by price level.
5. Scripts: where to find them and how to start
Scripts are code instructions for creating visual studies. You do not need to program to use the 97 ready-made indicators.
- Open INDICADORES and select Scripts.
- Use Añadir manualmente (Add manually) to open the Código Lua / QCS editor, or Importar script (Import script) to start importing a file.
- The version reviewed opened the editor with a period-14 moving-average example. Review its name, parameters and code before use.
- Guardar (Save), Guardar y aplicar (Save and apply) and Exportar (Export) distinguish saving the code, saving and applying the study, and exporting it. Check the result and any on-screen messages.
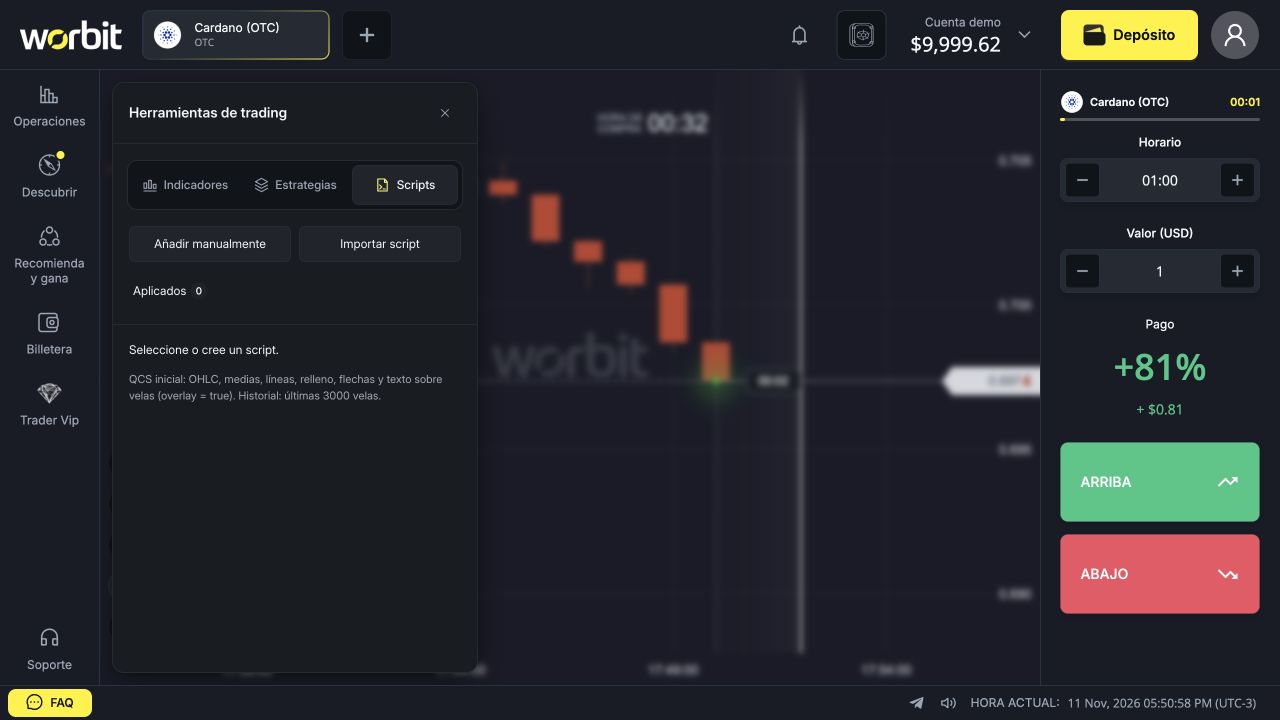
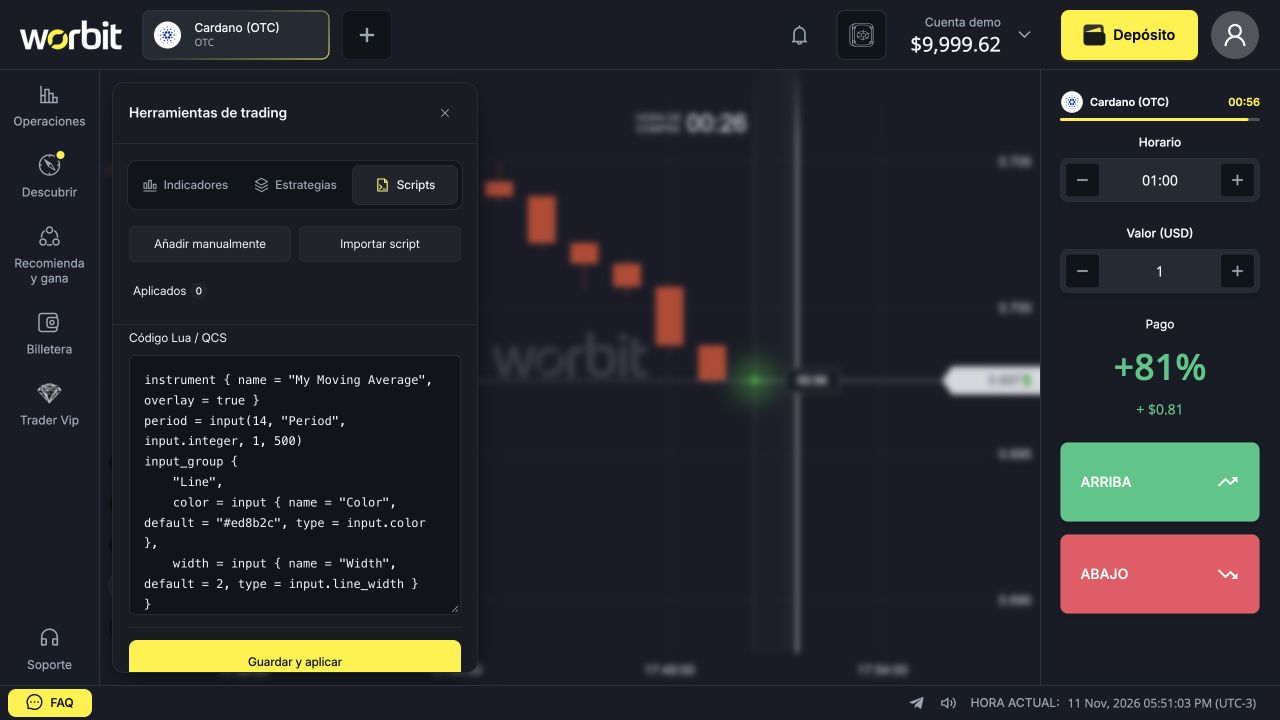
The interface states initial support for OHLC, averages, lines, fills, arrows and text over candles with overlay = true, using the last 3,000 candles. Do not assume full compatibility with other platforms’ code because names look similar. This feature is not a robot that opens trades automatically.
6. How does Estrategias differ?
Indicadores lets you choose individual studies; Estrategias (Strategies) offers ready-made sets. The screen warns that a strategy replaces current indicators while keeping scripts, candle period and trade duration. Record your parameters before trying another set.
A strategy organises analysis tools; its name or difficulty rating does not guarantee winning trades. Times on the cards do not replace checking Horario.
7. Frequently asked questions
Why has the indicator not appeared? Confirm you selected Aplicar, open Añadido and check the eye. Some studies appear below the candles; others appear over price. Check colours, opacity and whether enough price history is available; Special K needs extensive history. If it still does not appear, contact internal support with the study name, asset, candle period and parameters.
Why does it change before the candle closes? The forming candle’s price can change, affecting calculations. Fractals need later confirmation, and ZigZag’s final leg is provisional. A historical mark does not mean that information was available when the candle began.
Why does it differ from another platform? Compare asset, price source, candle period, history and parameters. The same name does not guarantee identical data or implementations. Do not copy a value without checking these conditions.
Do more indicators improve analysis? Not necessarily. Similar studies may repeat information and make the chart harder to read. Understand each one before combining them.
Can they automatically cancel or protect a trade? Do not confuse analytical lines with orders. ATR Trailing Stops, Chande Kroll Stop and Parabolic SAR do not themselves send stop orders or cancel trades.
Which settings guarantee profit? None. Indicators describe or transform data and may produce false readings. Learn the controls in demo before considering their use with real funds.
See the guides to ready-made strategies and scripts.
Related articles: Tools and indicators · Candle period and trade duration · An already-open trade · Demo account.
Indicator or drawing: which tool do you need?
Indicators are calculated from chart data; drawings are marks you add yourself. For lines, text, rectangles and other marks, open HERRAMIENTAS GRÁFICAS (Drawing tools) and see how to draw on the chart. These features do not trade for you or guarantee results.
An indicator’s period belongs to its calculation; it is not trade duration. See candle period and trade time.