
Drawing tools let you mark levels, sections and observations on the chart. These are your annotations: they do not submit trades, change asset prices or guarantee that a level will hold.
Open the tools
- Find HERRAMIENTAS GRÁFICAS (Drawing tools) in the left toolbar.
- Select the icon to open the menu.
- Choose a tool. Scroll through the list if the last options are not visible.
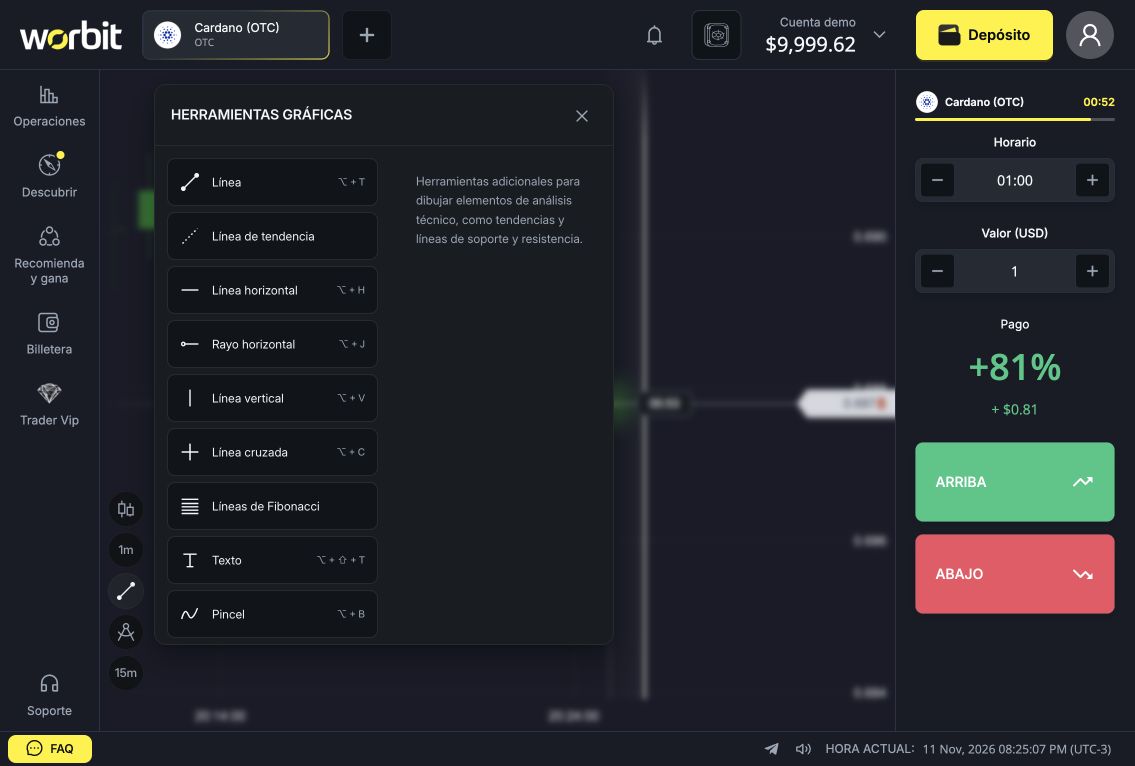
Example: create a horizontal line
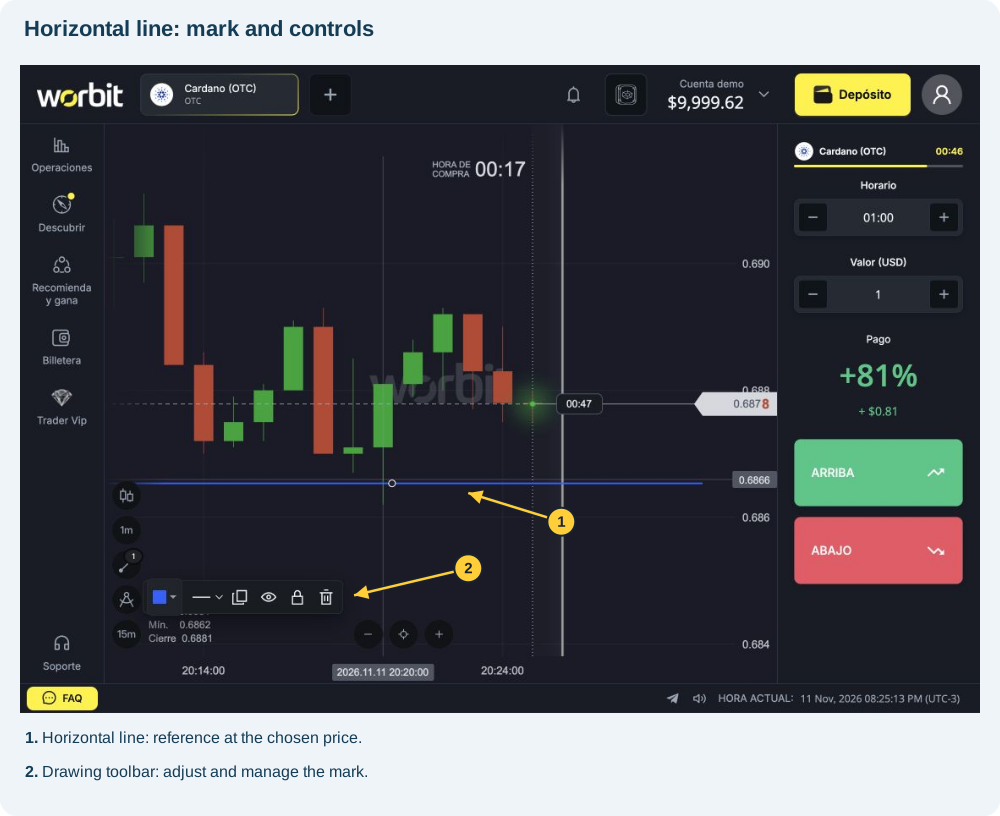
- Select Línea horizontal (Horizontal line).
- On the chart, click at the price level you want to mark.
- Check the line. In the test it appeared selected, with a toolbar for colour, thickness, duplication, visibility, locking and deletion.
- Use it as a visual reference. To edit or delete it, see how to manage drawings.
Which tools are available?
| On-screen name | Purpose |
|---|---|
| Línea (Line) | Connect points on the chart. |
| Línea de tendencia (Trend line) | Mark a direction by connecting points in a movement. |
| Línea horizontal (Horizontal line) | Highlight a price level. |
| Rayo horizontal (Horizontal ray) | Mark a level from a reference point. |
| Línea vertical (Vertical line) | Highlight a position in time. |
| Línea cruzada (Cross line) | Combine horizontal and vertical references. |
| Líneas de Fibonacci (Fibonacci lines) | Study proportional levels between chosen references. |
| Texto (Text) | Add a written observation. |
| Pincel (Brush) | Draw a freehand mark. |
| Trayectoria (Path) | Represent a path through points. |
| Rectángulo (Rectangle) | Highlight a chart area. |
The number of points and way to finish vary by tool. Observe the controls when selecting it. This example specifically demonstrates the horizontal line.
Support and resistance are references
You can mark areas where price struggled to continue in the past. A lower area can be studied as support; an upper one, as resistance. These marks express your analysis, not compulsory market boundaries. Price can cross them.
Avoid filling the screen with similar lines. Keep references identifiable and check asset and period before comparing marks. Drawings and indicators have separate controls.
See also: indicator guide · editing, locking, hiding and deleting drawings · chart troubleshooting.
For moving averages, RSI and other calculated studies, use INDICADORES. See the full catalogue. To change or remove an existing mark, see how to edit and delete drawings.