
MACD compares exponential averages and displays a signal line and a histogram. It helps show changes in momentum and in the relationship between faster and slower references.
Add it and check the parameters
- Open INDICADORES → Indicadores (Indicators) and find MACD.
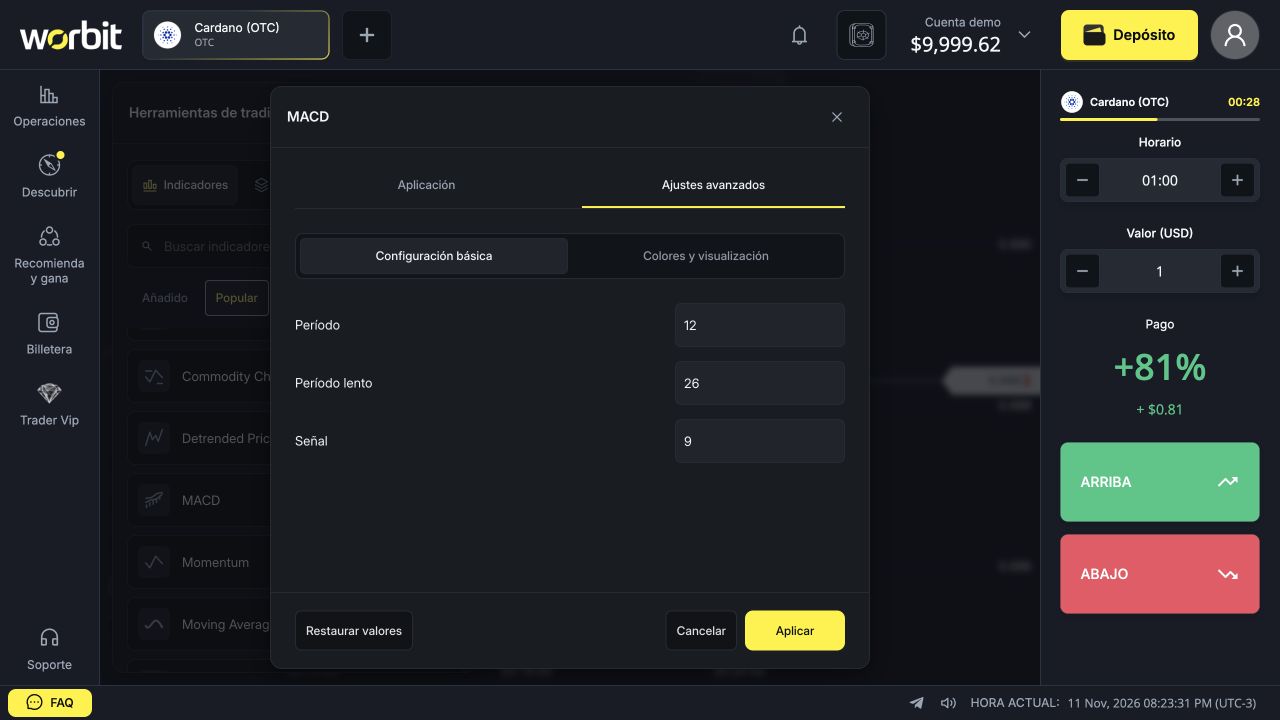
- Under Ajustes avanzados (Advanced settings), check Período (Period), Período lento (Slow period) and Señal (Signal).
- The initial settings observed were 12, 26 and 9, respectively.
- Select Aplicar (Apply). The study appears in a panel below the chart.
What does each part represent?
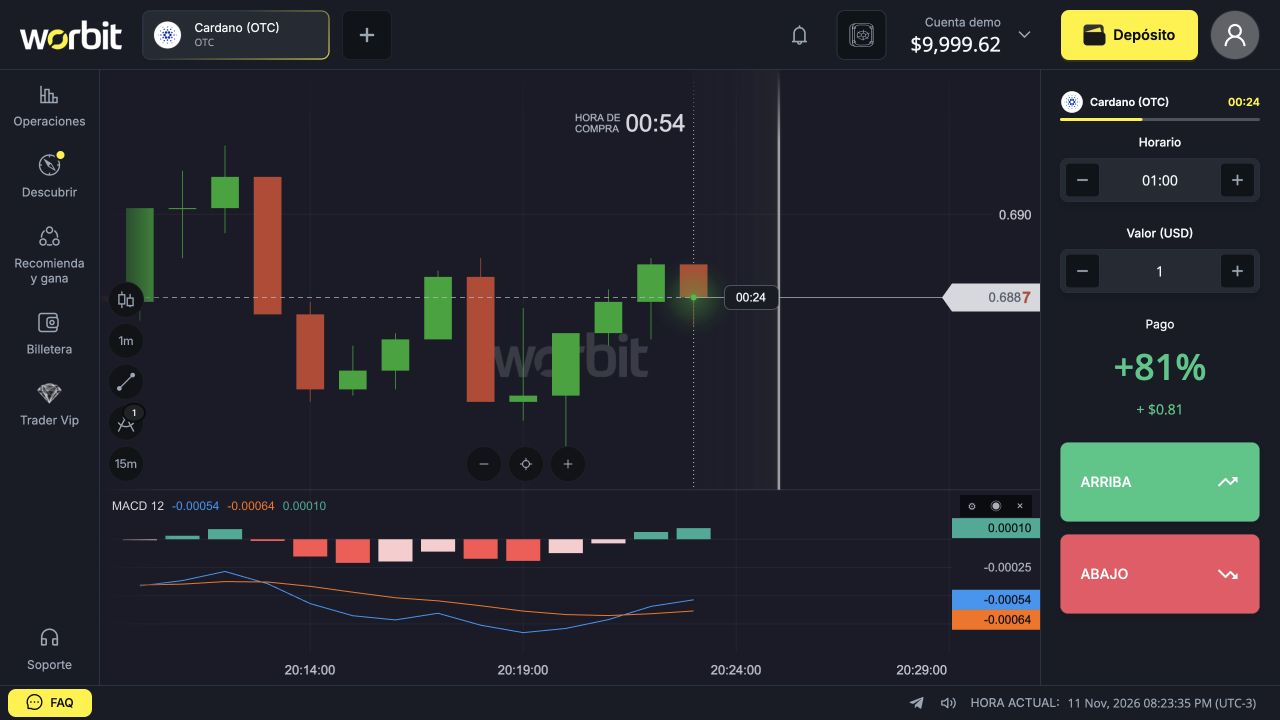
- MACD line: the difference between fast and slow exponential averages.
- Signal line: a smoothed reference for comparison with MACD.
- Histogram: the difference between MACD and its signal line.
- Zero: the balance reference for the corresponding difference, not a zero asset price.
Understand crossings and bars
When MACD moves above the signal line, the relationship between them changes. This is not the same as crossing zero: MACD may be above the signal line while still below zero. Identify which crossing you are analysing.
Histogram bars increasing in absolute size show greater separation between the lines; bars approaching zero show that separation shrinking. A positive bar does not mean your trade won, and a negative bar does not mean a loss.
Reading considerations
Without a clear market direction, crossings may repeat quickly. Because the indicator uses averages, its response may follow the price change. The forming candle may also change the reading before it closes.
Changing periods changes sensitivity. Record your values before comparing screenshots or results. To adjust, use the edit icon under Añadido; to remove only MACD, use its row’s X.
See also: indicator guide · moving averages · chart troubleshooting.