
The Relative Strength Index (RSI) compares smoothed gains and losses on a scale from 0 to 100. It helps show the movement’s relative strength. It does not show the probability of a winning trade: RSI at 70 does not mean a 70% chance of a rise.
Add RSI
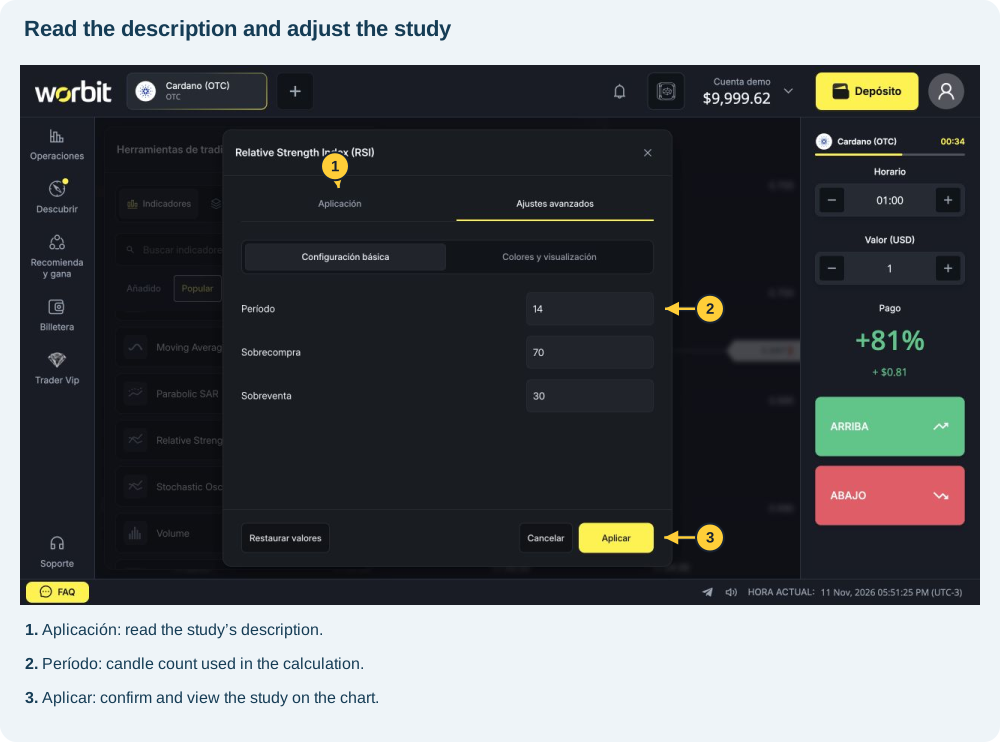
- Open INDICADORES → Indicadores (Indicators).
- Find Relative Strength Index (RSI).
- Under Ajustes avanzados (Advanced settings), check Período (Period), Sobrecompra (Overbought) and Sobreventa (Oversold).
- The initial settings observed were 14, 70 and 30.
- Select Aplicar (Apply) and look at the panel below the candles.
What do the levels mean?
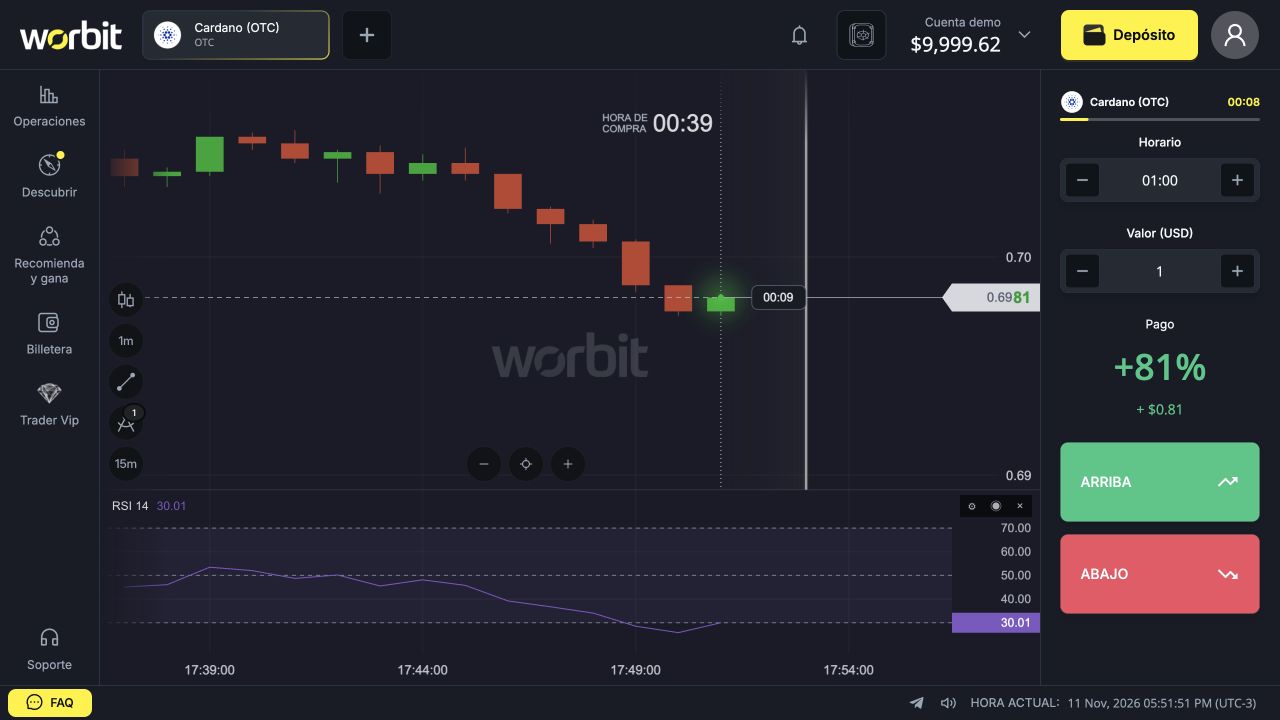
- Near 50: the scale’s middle reference.
- Above 70: the area conventionally called overbought, if that is the configured level.
- Below 30: the area conventionally called oversold, if that is the configured level.
These names describe indicator areas. During a strong movement, RSI may stay high while price rises or low while price falls. Do not open ABAJO (Down) solely because RSI exceeds 70, or ARRIBA (Up) solely because it falls below 30.
How to interpret a change
Observe the path, not just one number. RSI moving from 25 to 35 has left the area below 30, but does not confirm that price will keep rising until your trade closes. Trade timing and candle period are different pieces of information.
The reading may change while the current candle remains open. Comparing a momentary crossing with the final appearance of historical data may lead to a mistaken interpretation.
Settings and common questions
A shorter period usually makes RSI more sensitive; a longer one smooths its response. Changing Sobrecompra and Sobreventa changes reference levels, not protection against losses. To edit, open Añadido and the edit icon; to hide, use the eye; to remove, use the row’s X.
If RSI 9 appears instead of RSI 14, check whether you applied a ready-made strategy: it may set different parameters. In the test, Explorador added period-9 RSI.
See also: complete indicator guide · ready-made strategies · chart troubleshooting.